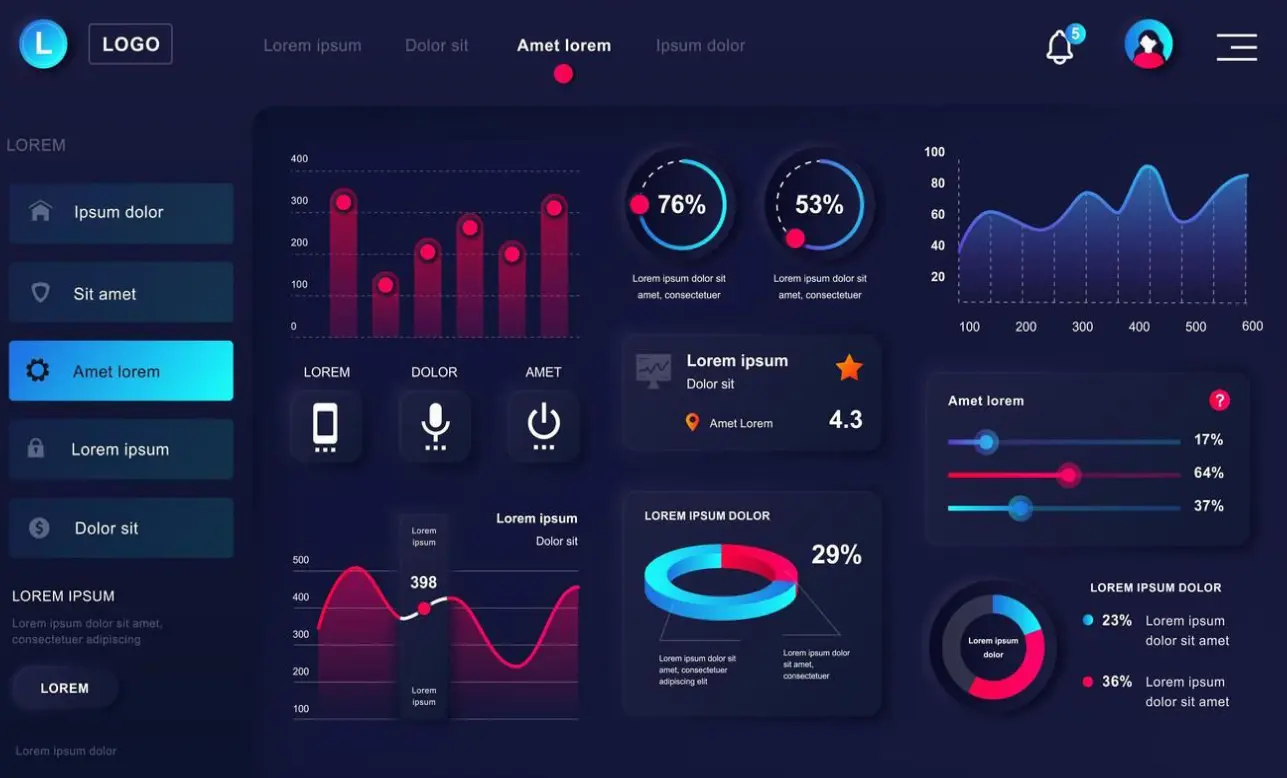



Build interactive dashboards, clear visual reports, and practical business insights with Power BI.
Learn how to design interactive dashboards and business intelligence reports with Power BI. Build a strong foundation in data preparation with Power Query, data modeling with relationships and star schemas, and advanced calculations using DAX to turn raw information into clear business insights. Work with multiple data sources, publish reports to Power BI Service, configure refresh schedules, apply row-level security, and create visual stories that help teams track KPIs and make decisions faster. The course focuses on practical reporting techniques used in finance, sales, operations, and management reporting.
Create dashboards, transform and model data, write DAX measures, publish reports, manage workspaces, and deliver reliable self-service analytics for business users and leadership teams.
It is designed to validate the knowledge, skills, and competencies of individuals in a specific area of study or professional field. The certification program is meticulously designed to ensure that candidates have acquired a comprehensive understanding of the subject matter. It encompasses both theoretical knowledge and practical application, allowing candidates to demonstrate their expertise in real-world scenarios.
The curriculum covers data extraction, cleaning, transformation, modeling, DAX calculations, visualization design, and dashboard development in Power BI. You will learn how to connect multiple data sources, build reusable reports, and create metrics that reflect business performance accurately. Later modules focus on publishing to Power BI Service, managing refresh schedules, implementing row-level security, and maintaining report quality as datasets grow. Project work emphasizes practical dashboards for real business scenarios and clear communication of findings to stakeholders.



.jpg)